-
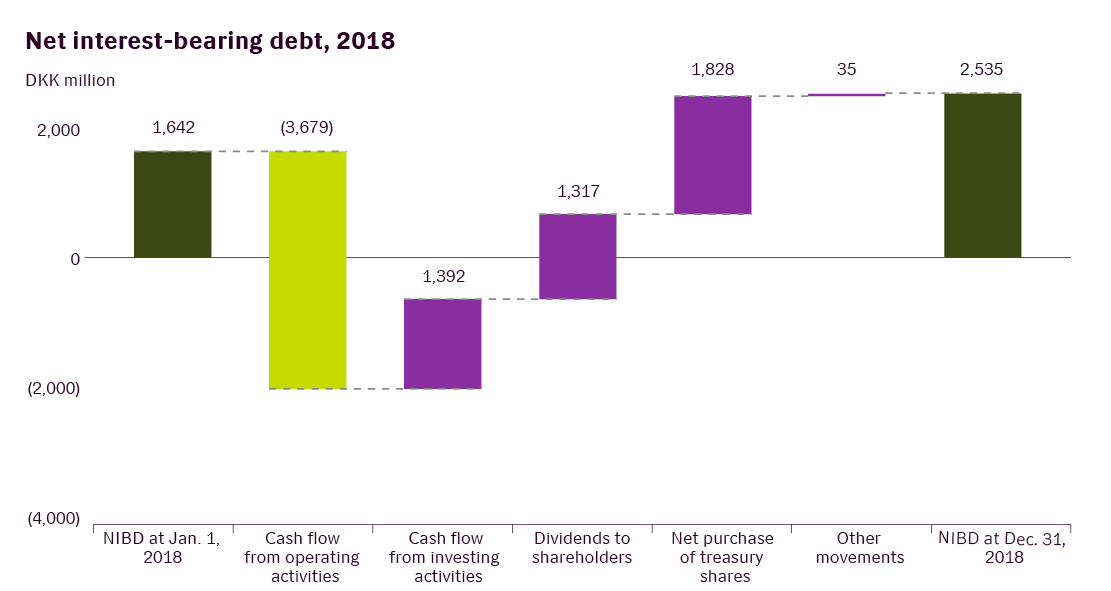
NIBD/EBITDA at December 31, 2018
0.5x
-
Return on equity up from 27.1% to
28.4%
-
Novozymes bought back 6.2 million B shares under the stock buyback program with a transaction value of DKK million
2,000
Novozymes’ international operations mean that our earnings and financial position are exposed to a number of financial risk factors. Financial risks are managed centrally for the entire Group. The Treasury Policy is approved by the Board of Directors, and sets the limits for the various financial risks and the derivatives used to hedge the risks. The Treasury Policy is adjusted on an ongoing basis to adapt to the market situation, and contains rules on which derivatives can be used for hedging, which counterparties can be used and the risk profile that is to be applied.
Currency risk
Currency risk arises due to imbalances between income and costs in each individual currency and because Novozymes has more assets than liabilities in foreign currencies in connection with global operations.
Hedging of currency risk is carried out in the currencies where Novozymes has the largest exposure. The hedging is managed by entering into derivatives such as forward contracts, currency options and swaps. Loans and deposits in foreign currencies are also utilized as hedging. Hedge effectiveness is assessed on a regular basis by comparing changes in the timing and value of the expected exposure in the relevant currencies with the timing and value changes for the designated cash flow-hedging transaction.
Currency risk related to net investments in foreign subsidiaries is hedged where this is deemed appropriate by taking out loans and entering into swaps. Currently, there are no open transactions used to hedge equity investments.
Foreign exchange sensitivity – 2018
The sensitivity analysis below shows the impact on net profit and other comprehensive income of a 5% change in the DKK versus the key currencies to which Novozymes was exposed on December 31, 2018. For other comprehensive income, the analysis shows the impact on currency translation of net investments and does not include the impact of cash flow hedges, as these relate to future commercial transactions.
The sensitivity analysis reflects the transaction and translation risk, and assumes that the exchange rates change on December 31, 2018, and that all other variables remain constant. The table shows the effect of an increase in exchange rates. A decrease in the exchange rate would have an opposite effect.
Foreign exchange sensitivity – 2019 estimate
Operating profitSee EBIT. (EBIT) is exposed to currency changes, as the effect of hedges is included in financial income/costs. EBITEarnings before interest and tax. See Operating profit is mainly exposed to the USD and EUR. A movement of 5% in the USD would result in a change in the expected EBIT for 2019 of around DKK 130-160 million (2018: DKK 110-130 million). A 5% movement in the EUR would result in a change in expected EBIT for 2019 of around DKK 200 million (2018: DKK 200 million). Of the expected USD cash flows for 2019, 100% has been hedged by forward contracts at an average rate of DKK 6.21. As a result, the impact on net profit from changes in the USD has been reduced significantly compared with the impact on EBIT.
| Foreign exchange analysis |
|
|
2018 |
2017 |
| DKK million |
|
Increase in exchange rates |
Change in net profit |
Change in other comprehensive income |
Change in net profit |
Change in other comprehensive income |
| CHF |
|
5.0% |
(1) |
59 |
(4) |
74 |
| CNY |
|
5.0% |
(2) |
116 |
(1) |
107 |
| USD |
|
5.0% |
2 |
236 |
1 |
212 |
| Other |
|
5.0% |
(1) |
90 |
8 |
85 |
| Total |
|
|
(2) |
501 |
4 |
478 |
|
|
|
|
|
|
|
Interest rate risk
Interest rate risk arises in relation to interest-bearing assets and liabilities. In accordance with Novozymes’ Treasury Policy, a minimum of 30% of loans must be at fixed interest rates. Hedging of the interest risk is managed by entering into fixed-rate loans and interest rate swaps.
With the current hedging of interst risk, an increase of 1 percentage point in the average interest rate on Novozymes’ net interest-bearing debt would have a negative effect on net profit of DKK 8 million (2017: negative effect of DKK 2 million). At December 31, 2018, 62% (2017: 72%) of the loan portfolio was at fixed interest rates.
Credit risk
Credit risk arises especially on cash and cash equivalents, derivatives, trade receivables and contract assets. The credit risk on trade receivables and contract assets is countered by thorough, regular analysis based on customer type, country and specific conditions. The credit risk on cash and cash equivalents as well as derivatives is mitigated by the Treasury Policy, which limits exposure solely to counterparties that have an investment-grade credit rating. The credit risk is calculated on the basis of net market values and is governed by the Treasury Policy. Novozymes has entered into netting agreements (ISDA or similar) with all the banks used for trading in financial instruments, which means that Novozymes’ credit risk is limited to net assets.
At December 31, 2018, the Group considered its maximum credit risk to be DKK 3,795 million (2017: DKK 3,383 million), which is the total of the Group’s financial assets. At December 31, 2018, the maximum credit risk related to one counterparty was DKK 308 million (2017: DKK 313 million).
Liquidity risk
In connection with the Group’s ongoing financing of operations, including refinancing, efforts are made to ensure adequate and flexible liquidity. This is guaranteed by using committed credit facilities and placing free funds in deposits, government bonds or ultra-liquid mortgage bonds in accordance with the Treasury Policy.
At December 31, 2018, Novozymes’ financial resources amounted to DKK 4,023 million (2017: DKK 4,307 million), consisting of net cash and cash equivalents and undrawn committed credit facilities of DKK 3,646 million, which expire in 2020-2023.
With the exception of debt to credit institutions, the maturity dates are primarily within one year.
| DKK million |
|
2018 |
2017 |
| Interest income |
|
10 |
7 |
| Gains on cash flow hedges |
|
- |
12 |
| Gains on fair value hedges, net |
|
26 |
- |
| Other foreign exchange gains, net |
|
- |
71 |
| Fair value adjustments of cash-settled stock options |
|
11 |
- |
| Financial income |
I/S |
47 |
90 |
|
|
|
|
| Interest costs |
|
(13) |
(27) |
| Losses on cash flow hedges, net |
|
(42) |
- |
| Losses on fair value hedges, net |
|
- |
(56) |
| Other financial costs |
|
(22) |
(24) |
| Other foreign exchange losses, net |
|
(73) |
- |
| Write-down of financial asset |
|
(14) |
(120) |
| Fair value adjustments of cash-settled stock options |
|
- |
(20) |
| Financial costs |
I/S |
(164) |
(247) |
|
|
|
|
| Financial income/costs, net |
|
(117) |
(157) |
The financial asset relating to the partnership with Beta Renewables S.p.A. was fully written down in 2017. This related to a guarantee provided by M&G because cellulosic ethanolBiofuel made from cellulosic materials, which include agricultural residues such as corn cobs, stover and straw, forestry waste and municipal solid waste. projects had not commercialized as expected in Beta Renewables S.p.A. The write-down of DKK 120 million, included in Financial costs, was made because M&G was experiencing financial difficulties.
ACCOUNTING POLICIES
Financial income and Financial costs comprise interest income and interest costs, realized and unrealized foreign exchange gains and losses, as well as fair value adjustments of cash-settled stock-based incentive programs, which are offset against Other liabilities and fair value adjustments of Other financial assets.
Financial income and Financial costs also include fair value adjustments of derivatives used to hedge assets and liabilities, and income and costs relating to cash flow hedges that are transferred from Other comprehensive income on realization of the hedged item.
| DKK million |
|
|
|
|
2018 |
2017 |
| Credit institutions |
|
|
|
|
3,258 |
2,274 |
| Derivatives |
|
|
|
|
115 |
17 |
| Other financial liabilities at December 31 |
|
|
3,373 |
2,291 |
|
|
|
|
|
|
|
| Recognized in the balance sheet as follows: |
|
|
|
|
|
|
| Non-current |
|
|
|
B/S |
1,474 |
1,312 |
| Current |
|
|
|
B/S |
1,899 |
979 |
| Other financial liabilities at December 31 |
|
|
3,373 |
2,291 |
| Liabilities arising from financing activities |
|
|
|
|
|
|
|
|
|
|
| DKK million |
2016 |
Financing cash flows |
Foreign exchange movement |
Other movements |
2017 |
Financing cash flows |
Foreign exchange movement |
Other movements |
2018 |
| Long-term borrowing |
1,713 |
- |
2 |
(411) |
1,304 |
746 |
3 |
(584) |
1,469 |
| Short-term borrowing |
90 |
460 |
- |
420 |
970 |
232 |
3 |
584 |
1,789 |
| Total liabilities from financing activities at December 31 |
1,803 |
460 |
2 |
9 |
2,274 |
978 |
6 |
- |
3,258 |
| * Other movements include the effect of reclassification of non-current portion of interest-bearing loans and borrowings. |
|
|
|
|
Credit institutions – currency 2018 (2017)
Credit institutions – time to maturity 2018 (2017)
-
Less than 1 year
-
Between 1 and 5 years
-
More than 5 years
Loan portfolio – fixed or floating interest rate 2018 (2017)
-
Fixed interest rate
-
Floating interest rate
Fair value hedges
The table below shows the derivatives the Group has contracted to hedge currency exposure on financial assets and liabilities that give rise to currency adjustments in the income statement.
|
2018 |
2017 |
| DKK million |
Contract amount based on agreed rates* |
Fair value
Dec. 31 |
Contract amount based on agreed rates* |
Fair value
Dec. 31 |
| Forward exchange contracts |
|
|
|
|
| CAD |
(343) |
(9) |
(332) |
2 |
| CHF |
(1,351) |
12 |
(1,453) |
(1) |
| USD |
182 |
- |
280 |
1 |
| Other |
236 |
(13) |
175 |
(2) |
| Fair value hedges at December 31 |
(1,276) |
(10) |
(1,330) |
- |
| * Positive contract amounts represent a sale of the respective currency, and negative amounts represent a purchase. |
The forward exchange contracts fall due in the period January 2019 to June 2019 (2017: January 2018 to May 2018).
The fair value hedges were 100% effective, as the gain on forward exchange contracts was DKK 26 million (2017: gain of DKK 56 million), compared with a loss on the hedged items of DKK 26 million (2017: loss of DKK 56 million).
Cash flow hedges
The table below shows the derivatives that the Group has contracted to hedge currency and interest rate exposure in future cash flows.
|
2018 |
2017 |
| DKK million |
Contract amount based on agreed rates* |
Fair value
Dec. 31 |
Contract amount based on agreed rates* |
Fair value
Dec. 31 |
| Forward exchange contracts |
|
|
|
|
| USD |
2,235 |
(82) |
1,855 |
11 |
|
2,235 |
(82) |
1,855 |
11 |
|
|
|
|
|
| Interest rate swaps |
|
|
|
|
EUR/EUR – pays fixed rate of 3.58% / earns variable rate of (0.271%)
(2017: (0.273%)) |
112 |
(4) |
112 |
(9) |
DKK/DKK – pays fixed rate of 0.595% / earns variable rate of (0.150%)
(2017: (0.165%)) |
521 |
(5) |
521 |
(2) |
|
633 |
(9) |
633 |
(11) |
|
|
|
|
|
| Cash flow hedges at December 31 |
2,868 |
(91) |
2,488 |
- |
| * Positive contract amounts represent a sale of the respective currency, and negative amounts represent a purchase. |
The forward exchange contracts fall due in the period January 2019 to December 2019 (2017: January 2018 to December 2018), and the swaps fall due in July 2019 and May 2026 (2017: July 2019 and May 2026).
At the end of 2018, the Group had hedged 100% of expected future cash flows in USD for 2019 at an average rate of DKK 6.21 (2017: 100% of expected future cash flows in USD for 2018 at an average rate of DKK 6.18).
ACCOUNTING POLICIES
Hedge accounting consists of positive and negative fair values of derivatives, which are recognized in the balance sheet under Other financial assets and Other financial liabilities respectively.
Derivatives used for fair value hedges are measured at fair value on the reporting date, and value adjustments are recognized as Financial income or Financial costs.
Derivatives used for cash flow hedges and hedges of net investments in subsidiaries are measured at fair value on the reporting date, and value adjustments are recognized in Other comprehensive income.
Income and costs relating to cash flow hedges and hedges of net investments in subsidiaries are transferred from Other comprehensive income on realization of the hedged item and are recognized as Financial income or Financial costs.
Derivatives are recognized at the transaction date.
|
|
2018 |
2017 |
|
|
No. |
Nominal value DKK million |
No. |
Nominal value DKK million |
| Common stock |
|
|
|
|
|
| A common stock (shares of DKK 2) |
|
53,743,600 |
107 |
53,743,600 |
107 |
| B common stock (shares of DKK 2) |
|
243,256,400 |
487 |
251,256,400 |
503 |
| Common stock at December 31 |
B/S |
297,000,000 |
594 |
305,000,000 |
610 |
|
|
|
|
|
|
| Treasury stock - B stock |
|
|
|
|
|
| Treasury stock at January 1 |
|
12,051,096 |
24 |
12,381,738 |
25 |
| Additions during the year |
|
6,167,092 |
13 |
6,770,271 |
13 |
| Disposals during the year |
|
(812,382) |
(2) |
(2,100,913) |
(4) |
| Cancellation of common stock |
|
(8,000,000) |
(16) |
(5,000,000) |
(10) |
| Treasury stock at December 31 |
|
9,405,806 |
19 |
12,051,096 |
24 |
|
|
|
|
|
|
| No. |
|
|
|
2018 |
2017 |
| Shares of common stock in circulation |
|
|
|
|
|
| Shares of stock at January 1 |
|
|
|
292,948,904 |
297,618,262 |
| Purchase of treasury stock |
|
|
|
(6,167,092) |
(6,770,271) |
| Sale of treasury stock |
|
|
|
812,382 |
2,100,913 |
| Shares of common stock in circulation at December 31 |
|
|
|
287,594,194 |
292,948,904 |
Each A share gives an entitlement to 20 votes, while each B share gives an entitlement to two votes.
Each year, the Board of Directors assesses whether the ownership structure with A and B common stock is optimal. The Board of Directors maintains that this is the best way to safeguard Novozymes’ long-term development to the benefit of the company’s shareholders and other stakeholders.
The treasury stock is used to reduce the common stock and to hedge employees’ exercise of granted stock awards and stock options.
In 2018, Novozymes canceled 8 million treasury shares, reducing the common stock to 297 million shares.
The table below shows the Group's financial assets and financial liabilities at December 31 by category.
| DKK million |
Note |
2018 |
2017 |
| Trade receivables |
4.2 |
2,606 |
2,554 |
| Contract assets |
4.2 |
279 |
|
| Other receivables, excl. prepaid expenses |
4.3 |
153 |
152 |
| Cash and cash equivalents |
|
723 |
632 |
| Financial assets at amortized cost |
|
3,761 |
3,338 |
|
|
|
|
| Other financial assets |
|
20 |
29 |
| Fair value through profit and loss |
|
20 |
29 |
|
|
|
|
| Derivatives |
|
14 |
16 |
| Fair value through other comprehensive income |
|
14 |
16 |
|
|
|
|
| Financial assets |
|
3,795 |
3,383 |
|
|
|
|
| Credit institutions |
5.3 |
(3,258) |
(2,274) |
| Trade payables |
|
(1,418) |
(1,341) |
| Contract liabilities, excl. deferred income |
4.4 |
(374) |
|
| Other payables |
4.6 |
(625) |
(783) |
| Financial liabilities at amortized cost |
|
(5,675) |
(4,398) |
|
|
|
|
| Derivatives |
5.3 |
(115) |
(17) |
| Fair value through other comprehensive income |
|
(115) |
(17) |
|
|
|
|
| Financial liabilities |
|
(5,790) |
(4,415) |
Measurement and fair value hierarchy
All financial assets and liabilities, except for derivatives and other financial assets, are measured at amortized cost. The carrying amounts for these approximate fair value. Derivatives are measured at fair value based on observable data (level 2 input) according to the fair value hierarchy. The derivatives are not traded on an active market based on quoted prices, but are individual contracts. The fair value of these assets is determined using valuation techniques that utilize market-based data such as exchange rates, interest rates, credit risk and volatilities. Other financial assets are measured at fair value based on non-observable data (level 3 input). There are no financial instruments measured at fair value on the basis of quoted prices (level 1 input).